
Accuracy and Stability of SensaDyne Tensiometers
Accurate Measurement of Surface Age, Bubble Interval, and Bubble Frequency
Two probes of dissimilar orifice sizes (most commonly 0.5 mm and 4.0 mm) bubble into a fluid where the differential pressure value of the formed bubbles is measured. This value is directly proportional to the fluid surface tension. Since the method allows continuous bubbling, it also allows continuous in-process measurement. While classical methods measure only equilibrium (static) surface tension, Maximum Bubble Pressure Tensiometers can measure both equilibrium and dynamic surface tension, since the user can choose the rate at which the bubbles forms. This determines the Surface Age; the amount of time during which surfactant molecules can migrate to the gas/fluid interface. Additionally, by varying the bubble rate and therefore the surface age in a pre-selected sequence, a complete dynamic curve can be generated either manually using the QC-Series Tensiometers, or automatically, and repeated at user-programmed time intervals, using the PC500-Series Tensiometers.
SensaDyne Windows®-compatible software, Version 1.4.1, accurately measures and displays the Surface Age (bubble lifetime), Bubble Interval, and the Bubble Freqeuncy (the inverse of Bubble Interval), at all times, showing the real time results in the “Numerical Results” window of the main screen. This feature was originally added when we developed our Advanced (software) Peak Detection technique (APD), for detecting and monitoring maximum differential bubble pressure, which is exactly proportional to fluid surface tension. Because we can simultaneously track, measure, and time the pressure voltage waveform of the differential maximum bubble pressure signal, we can very accurately measure the valid peaks (maximum bubble pressure), the minimum peaks (capillary action, after the bubble releases from the orifice), the Bubble Interval and the bubble lifetime (Surface Age).
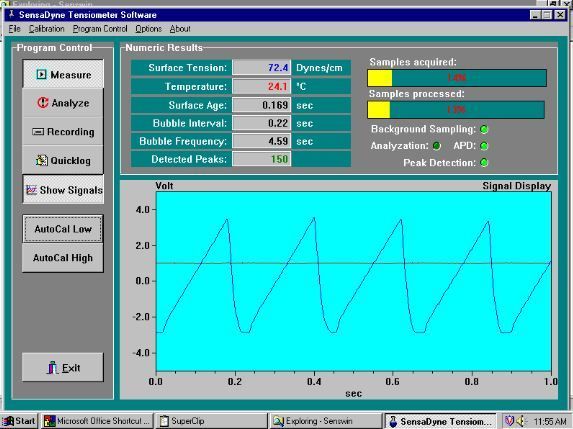
As shown in the screen display, the Bubble Interval has two components: Surface Age (the positive slope of the “saw tooth” pressure waveform), and Dead Time (negative slope of the waveform).
The limitations to how fast one can bubble in a specific fluid is determined primarily by the “Dead Time”; the time it takes for the bubble to break down after it reached maximum bubble pressure (an ideal hemispherical shape at the orifice tip), depart from the orifice, the time for the fluid to flow into the area vacated by the departing bubble, and the capillary action (based on the orifice size and physical configuration). A significant portion of this, which we cannot control, depends on the viscosity of the fluid. The dead time tends to be a relatively constant value, and effectively limits how fast one can bubble with a particular probe before transitioning to the “oscillating jet” mode. This limitation on how fast one can bubble into a fluid, holds true regardless of what bubble tensiometer is used. If the fluid contains a high level of solids then the “apparent viscosity” will be higher than the real viscosity and will add to this problem area. All Sensadyne Tensiometers have a viscosity compensation feature in the software program that can be used after applying Stokes Law to the initial bubble relationship set-up.
As the bubble interval decreases, surface age becomes proportionately smaller. For example, at one bubble per second, an aqueous solution will have a surface age of about 0.95 seconds; at ten bubbles per second the surface age will be in the range of 0.05 seconds; and at thirty five bubbles per second will be on the order of 3 to 5 milliseconds.
Differential Pressure Method versus Single Bubble Tensiometers
It is important to recognize that single bubble tensiometers utilize apparatus and pneumatic techniques for a single probe, that is quite different than one that we employ with the differential maximum bubble pressure method. First of all, we use mass flow controllers (MFCs) at each orifice to provide constant mass (volumetric) flow.
Some single bubble tensiometers have a “reservoir” with “dampening” chamber, used to dampen the pressure oscillations in the system. This technique allows a dynamic curve to be generated using a “burst” (varying frequency) technique, but the problem here is the fact that they do not consider the effect on pressure drop (ΔP) across the system (between transducer and orifice) which varies. There are also questions regarding other trade-offs used in their technique, such as use of an inclined capillary.
There is a third party article regarding limitations (inaccuracies) of some single bubble tensiometers, that was published several years ago in the SöFW Journal, International Journal of Applied Science, Issue ½-2004, Page 41-46. “Comparative Studies of Dynamic Surface Tensions of C12EO6 Solutions Measured by Different Maximum Bubble Pressure Tensiometers”. This was written by the original developers of the Lauda single bubble tensiometer, even though this is not acknowledged by the authors, so this bias needs to be recognized. The article explains why Sita and Kruss, single bubble tensiometers, will read lower than actual dynamic surface tension values. This will result in the user thinking that the surface tension of a formulation is lower than the surface energy of the substrate, and there is a positive wetting coefficient, when in fact there is not a positive wetting coefficient.
Physical orifice configurations and the materials of the probe tips are quite critical in surface tension results obtained in all bubble tensiometer methods, and dynamic curves can differ with differing set-ups. In the SensaDyne scheme of things, we chose to use Mass Flow Controllers (MFCs) which provide us with very stable and linear increases in mass flow at each orifice, unlike the “Lauda”, “SITA”, or “Krüss” single bubble tensiometer systems.
The SensaDyne electronics are designed to convert the differential pressure of the resulting bubble formations to a precise parallel electronic voltage signal that exactly duplicates the differential pressure. We know that what we generate as an electrical display signal is a true representation of the differential bubble pressure. In our Windows®-compatible software the display is concurrent with sampling and peak detection, In other words, real-time sampling, calculation, and display.
SensaDyne Tensiometers output a differential pressure signal rather than an absolute pressure signal, as used by single bubble pressure tensiometers. This means that all signals from the small orifice are “adjusted” by the contribution of the large orifice. For practical considerations we pneumatically dampen the large orifice signal (but only enough) to offset the effect of depth of immersion, specific gravity, and density, so that the resulting differential maximum bubble pressure is directly proportional to surface tension, and accurate to within +/-0.1 Dynes/cm (mN/m).
Accuracy of SensaDyne Differential Pressure Transducers
In our tensiometers, we use the Validyne DP15-series differential pressure transducer. The DP15 can also be used in pressurized applications to 250 PSI, and can easily be disassembled for maintenance and cleaning of the internal diaphragm and pressure cavities.
The frequency response of the Validyne DP15 is 80 Hz., more than twice the practical limit of bubble frequency for most dynamic surface tension applications. This response is at the input ports and the “plumbing” effect (length of tubing between the probe tips and the differential pressure transducer) must be applied to this to obtain an “effective” frequency response. On Validyne’s website www.validyne.com under the title: ”Estimating the Frequency Response of Variable Reluctance Pressure Sensors in Gas”, there can be found an excellent write-up on necessary ramifications and calculations, and a case study, with respect to this problem. The only difference is that we use 1/8” I.D. tubing instead of the 3/16” that the Validyne case study uses.